

Turn rental numbers into decisions · Part 4 of 7
Keep or sell a rental: compare the next chapter, not just the past
Compare keeping and selling a rental over the same future horizon. Include net proceeds, reinvested cash, debt, costs and clearly labelled tax sensitivities.


Compare what keeping and selling could produce from today over the same period. Historical returns help explain the past, but they cannot establish the better next use of your capital. Include the cash each path needs, net proceeds, taxes, risk and the work you will take on.
Start with a dated value estimate and an actual loan payout quote. Property value minus debt gives gross equity. It does not tell you how much you can reinvest after selling.
Give both paths the same starting point
Our hypothetical CAD example begins at the shared property's closing snapshot: estimated value CAD 520,000 and debt CAD 397,000. Gross equity is CAD 123,000. Assumed selling costs of 5%, or CAD 26,000, and payout charges of CAD 3,000 reduce immediate net proceeds to CAD 94,000 before income tax.
Those costs are teaching inputs, not quotes. The property's separate CAD 6,500 reserves are excluded equally from both paths. Do not count them as an extra benefit of only one option.
We compare five future years. The sell path invests CAD 94,000 at an assumed annual 4%, after assumed product fees and before tax. This is a model input, not a guaranteed return or an available product recommendation.
The hold path assumes annual CAD 3,000 owner cash after full debt service and CAD 3,000 actual annual capital spending. It assumes no additional reserve transfers or owner contributions. Each year's cash arrives at year-end and is reinvested at the same 4%. If your plan spends that cash, include equivalent withdrawals or consumption in both paths instead.
Count the ending loan once
The hold path assumes principal falls by CAD 3,000 each year. After five years, debt is CAD 382,000. With unchanged CAD 520,000 value, 5% sale costs and CAD 3,000 payout charges, terminal net proceeds are CAD 109,000 before tax.
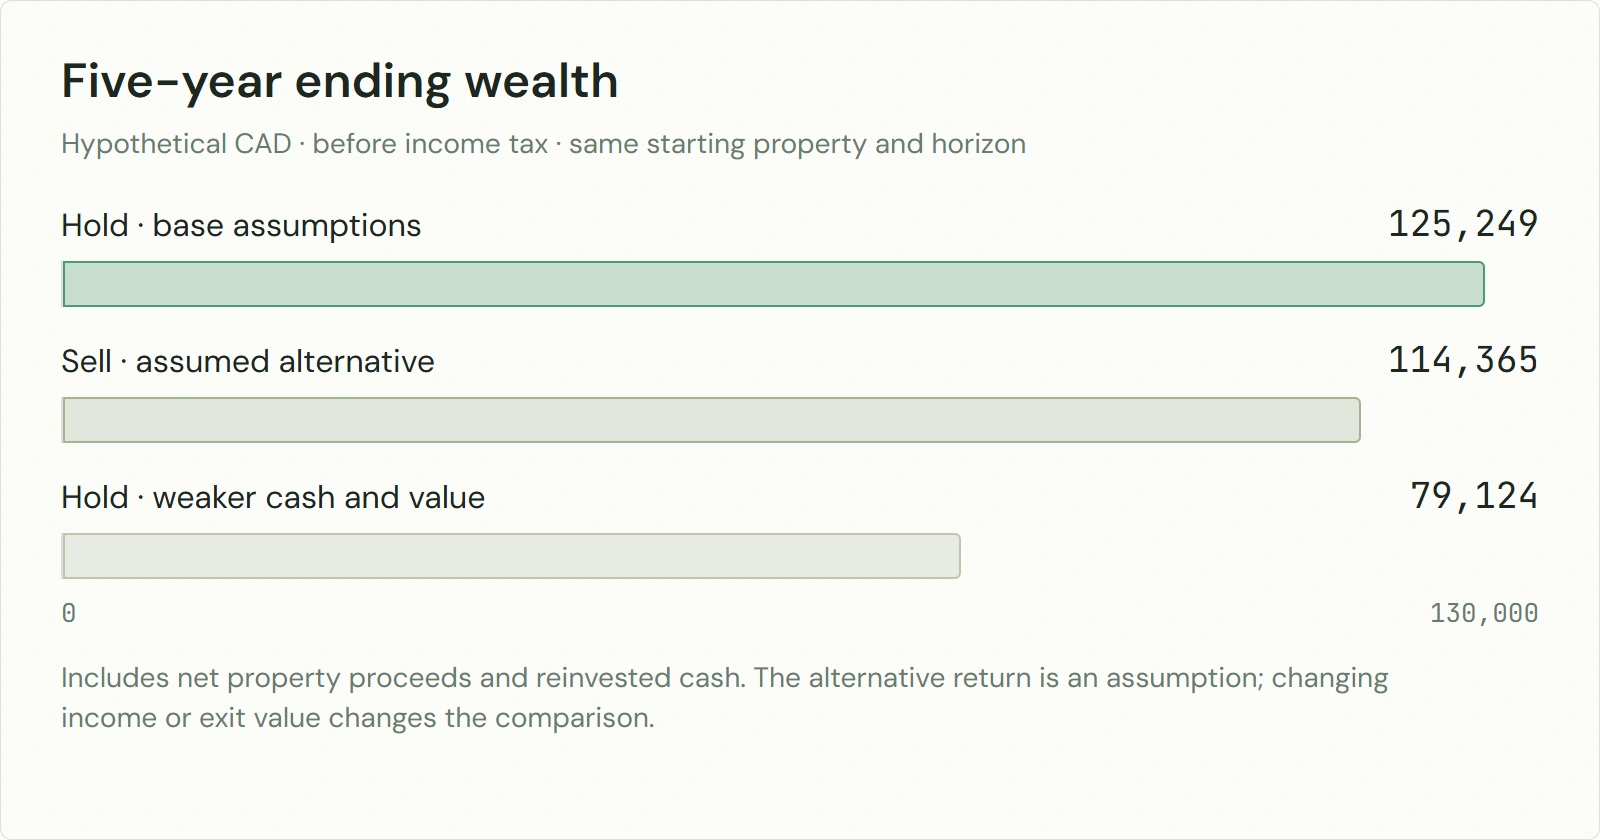
The future value of the five year-end cash receipts is about CAD 16,249. Add that to terminal proceeds: CAD 125,249 of ending wealth. Selling now and compounding CAD 94,000 produces about CAD 114,365 at the same date.
Do not add the CAD 15,000 principal reduction again: its benefit is already included in the lower terminal debt. The annual cash calculation already deducted full debt service.
| Five-year path | Terminal property proceeds, CAD | Other investment value, CAD | Total ending wealth, CAD |
|---|---|---|---|
| Hold, base assumptions | 109,000 | 16,249 | 125,249 |
| Sell now, assumed alternative | 0 | 114,365 | 114,365 |
| Hold, weaker cash and value | 71,000 | 8,124 | 79,124 |
The weaker hold case assumes annual owner cash of CAD 1,500 and terminal value of CAD 480,000. Debt reduction and payout charges stay fixed; selling costs become CAD 24,000. This is a separate sensitivity, not a forecast or assigned probability. It reverses the numerical comparison with the stipulated alternative, which is itself uncertain.
Add taxes before using the result
As an isolated sensitivity, suppose a CAD 10,000 sale-tax allowance applies either now or at the future property sale. Selling invests only CAD 84,000 and ends near CAD 102,199. Base holding ends near CAD 115,249 after subtracting the future allowance.
These are invented allowances, not Canadian or US tax calculations. Annual tax on rental cash and the alternative remains unmodelled, so this is not a fully after-tax comparison. Actual tax amounts and timing could change the choice. Model them for your jurisdiction before acting.
The Canadian cost-record guide separates capital gains from CCA recapture; the US depreciation and sale guide covers the US treatment. The completed mortgage break-cost guide explains the quote; use your signed terms and dated payout amount for the present comparison.
Compare more than the largest total
Ending wealth is one way to align the dates. For plans with different timings, a net present value comparison discounts each future cash flow to today using a stated required return; Iowa State's capital-budgeting explanation describes this time-value approach. The selected rate needs its own rationale. A dated XIRR can supplement the cash schedule, but a percentage alone hides amounts and funding needs.
Review current equity, expected work, tenant/lease events, management time and concentration. Test the alternative's losses and liquidity too. If operating top-ups exceed accessible funds, an attractive terminal estimate cannot pay the intervening bills.
Refresh this comparison annually or before a material transaction, with newer condition evidence, costs and tax estimates. That is a suggested cadence. A useful decision record states which assumptions drive the choice and what change would prompt a fresh review.
Sources
- Iowa State University Extension and Outreach, Capital Budgeting Basics, HTML updated June 2023, checked October 1, 2026; time-value and cash-flow framework. The property, reinvestment rates, costs and tax allowances above are hypothetical inputs, independently calculated.
Educational content, not financial, tax or legal advice.